
Who Voters Think is to Blame for Inflation
It varies greatly by community type


Who’s to blame for the economy’s continuing struggles with inflation? It all depends on where you are in the United States and in the 15 community types that define the American Communities Project.
In some places people point their fingers at the Trump Administration. Some see the Federal Reserve as the problem. And still others blame the Biden White House, according to an analysis from PharosGraph, a behavioral-science and artificial intelligence firm.
The PharosGraph analysis of attitudes about inflation for the month of May shows how the different communities in ACP see a variety of different forces behind the issue. And, ultimately, how the various demographics and social filters in the 15 community types lead to very different understandings of a crucial topic in the news.
Voter attitudes about inflation and who’s responsible for it, have been a driving force in American politics for the past several years now. The latest University of Michigan consumer sentiment index remained mired in the doldrums as concerns about inflation surged. And the latest PharosGraph data offers some surprises on the issue that will not go away.
Overall Numbers and How the Analysis Was Done
The national figures for blame on inflation show President Donald Trump catching most of the blame overall and that’s probably not surprise. First, presidents generally tend to get inordinate amounts of blame (and credit) for whatever happens to the national economy,rightly or wrongly. Second, Trump has made announcing tariffs a big part of his second time in the White House and that has led to a lot of national discourse on the impact of tariffs, which tends to be inflationary.

Overall, the national analysis found the Trump Administration is far-and-way the most likely to receive the blame for inflation. That 1.48 in the chart above reflects how much the Trump Administration over-indexes for blame compared to other potential targets and it sits pretty high above the next highest number, the Federal Reserve Bank, which only scores a .9 on the blame index.
Seeing the Fed come in second on the blame scores, may be something of a surprise. The Fed is a pretty complicated entity and, as we describe below, it’s not completely clear what’s behind that blame score.
Meanwhile, that fact that “corporate greed”narrowly over-indexes suggests that the administration’s argument that the nation’s big companies, particularly its big retailers, should “eat the tariffs” may be catching some momentum.
The below average index scores for the Biden Administration (-.93), China (-.95) and Immigration (-1.23) show other current targets of the Trump Administration’s ire don’t currently seem to betaking much heat at this point.
The work behind PharosGraph data is complicated and involved analyzing hundreds of thousands of stories from tens of thousands of US-based news outlets. The firm then used a large language model (LLM) to estimate how likely people with different socio-demographic characteristics and political preferences are to blame each target for inflation.
That approach married with the demographic data that exists behind the ACP’s typology was able to produce blame targets for each of the Project’s 15 community types that show just how complicated assigning blame can be.
Who Gets Blamed Where
This is where the PharosGraph data gets particularly interesting because the difference social, cultural and news consumption habits in the ACP types play a role in the inflation blame game. For each of the 15 community types we have listed the top and bottom blame targets for May below - along with the scores for each of them.
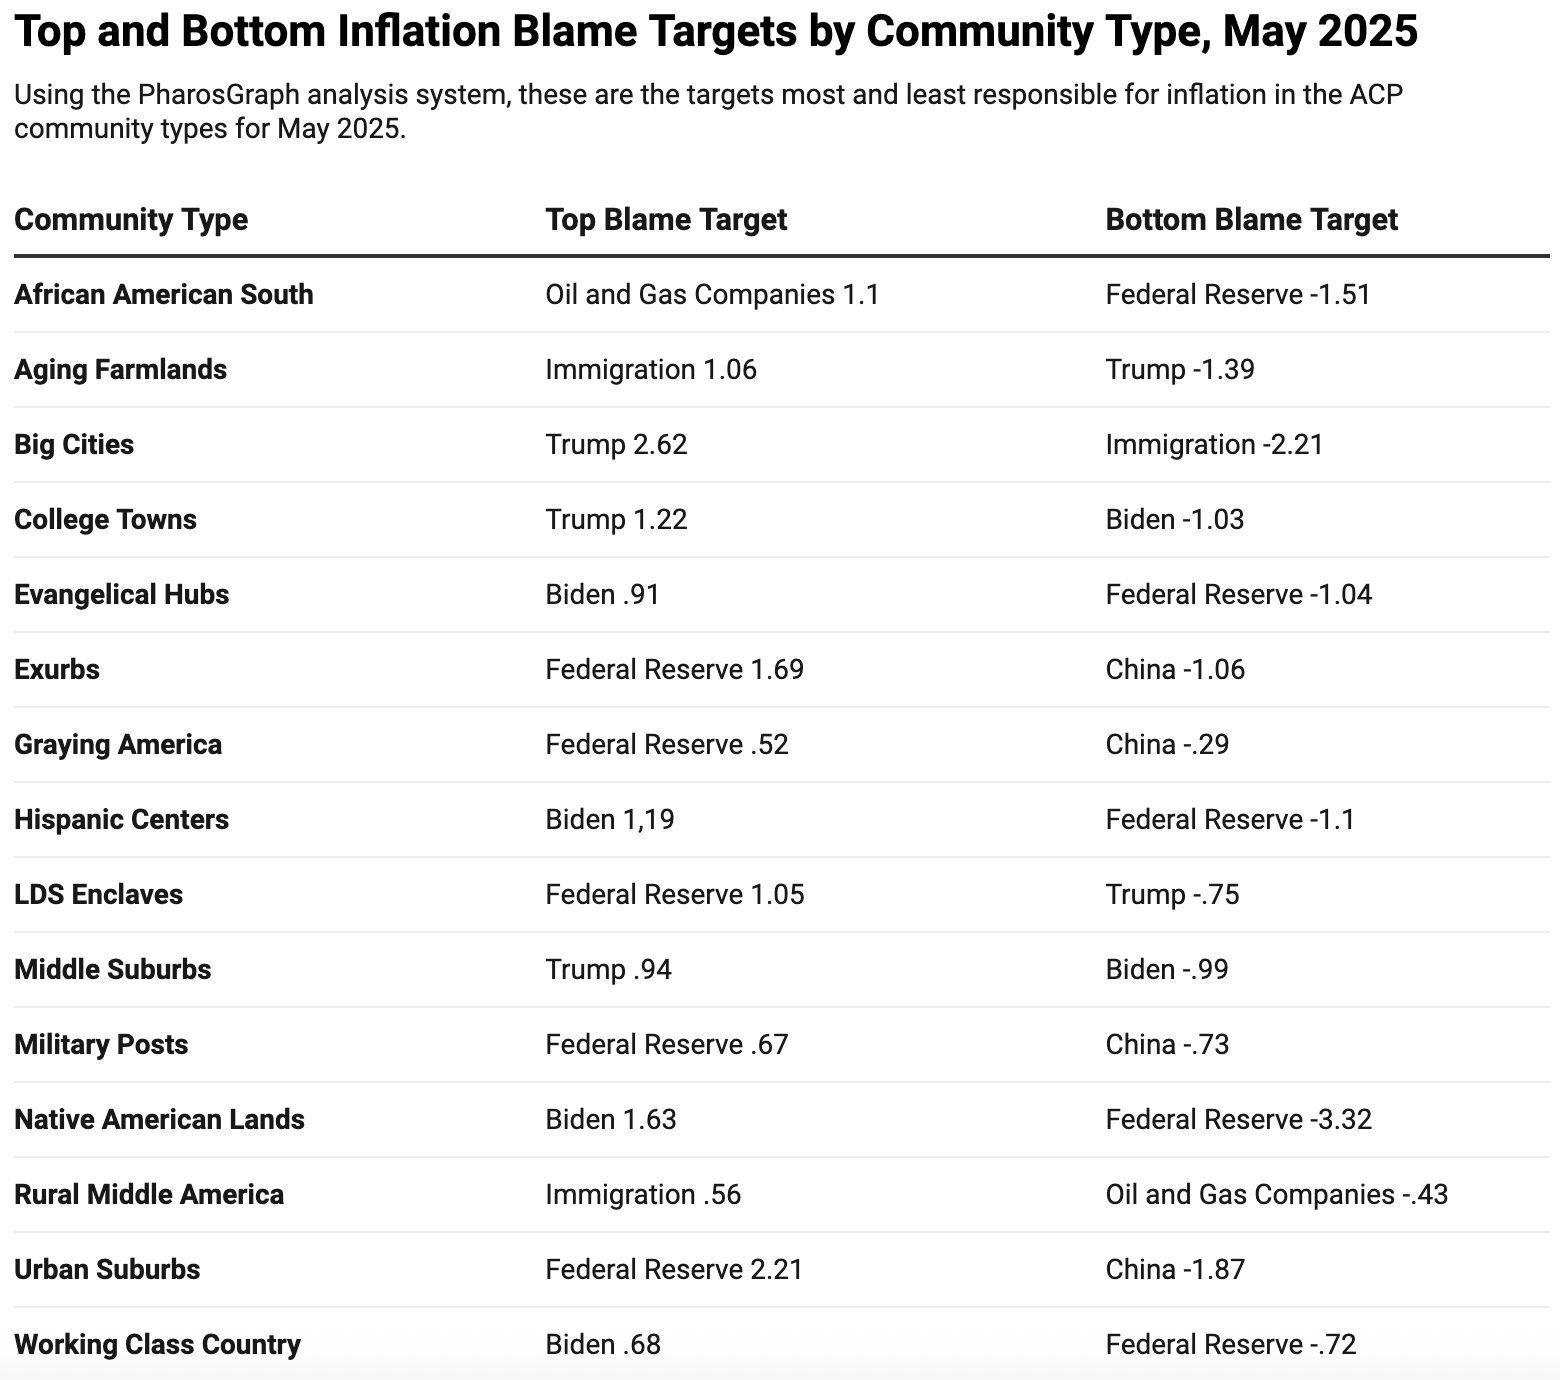
Trump as a blame target. The Trump Administration is the top blame target in three different ACP community types, the Big Cities, the College Towns and the Middle Suburbs.
The first two types are not a surprise. The Big Cities and College Towns both lean left politically and Democratic presidential nominee Kamala Harris, won both places comfortably in 2024, by 27 and 7 percentage point respectively. There are fewer Trump fans in them.
But the higher blame for Trump in the Middle Suburbs is a bit of a surprise. Those communities, mostly based around the Great Lakes, have been a source of strength for Trump in his three runs for the White House and are a big reason why he carried Michigan, Pennsylvania and Wisconsin in 2016 and 2024. Trump won the Middle Suburbs by about 13 percentage points in 2024.
So, what’s the story behind inflation blame in the Middle Suburbs? Well, those communities also have lower median household incomes, are more sensitive to inflation and, frankly, may have been expecting Trump to do more to “fix” inflation when he won. Granted that is no easy feat,but voters often want what they want. Regardless, the higher blame numbers for Trump in those places could become troubling for him if they don’t move or worsen by 2026.
The Federal Reserve as a target. In the ACP typology, the Fed was the top blame target in five of the 15 types – the Urban Suburbs, Exurbs, LDS Enclaves, Military Posts and Graying America – a rather surprising finding. Those types are home to very different kinds of people with different demographic markers and levels of educational attainment.
The Urban Suburbs and Exurbs have some of the highest rates of educational attainment In the ACP, while Graying America and Military Post sit under the national average.
Are these numbers a sign of how people in these communities thought the Fed mishandled the post-pandemic economy, a call for lower interest rates, or a reaction to Trump’s verbal attacks on the central bank? It’s impossible to know. The answer may be different in all these types.
Also worth noting, the Federal Reserve is last in assigned blame in five of the 15 community types. It’s all evidence that the Fed and people’s understanding of its mandate are quite complicated. People’s attitudes toward it bear watching in future months.
The Biden Administration as a target. Four of the ACP community types gave the most blame for inflation to the Biden Administration – Native American Lands, Hispanic Centers, Evangelical Hubs and Working Class Country. That may sound like a complicated and diverse set of places, and it is. But on the particular point of inflation blame, the driving factor is likely politics.
The Evangelical Hubs and Working Class Country are two of the biggest Trump supporting types in the ACP. Trump won those types in 2024 by 63 percentage points and 47 percentage points respectively. They are likely to see inflation as a problem that Trump inherited from Biden.
But Trump also won the Native American Lands and Hispanic Centers by double digits. And while those community types are racially and ethnically diverse, they are also often racially bifurcated. Those communities also have large white populations in them than lean very conservative politically – populations that are likely not fans of former President Biden.
China as a target. One somewhat surprising finding in these data is how little blame China receives in the numbers – even among places that lean heavily Republican.None of the ACP types has China as the top target for blame. And four of the community types – Urban Suburbs, Exurbs, Military Posts and Graying America –all have China at the very bottom of the seven possible blame targets.
At the very least, the data suggest that despite the brewing trade wars, China is not being seen as a villain in the great inflation war – at least not yet.
And that’s the important thing to keep in mind with all these data. Blame can be a slippery thing that shifts as news changes or people’s economic situations improve or deteriorate. The blame scores here are for the month of May. The numbers could look different in June or July or September.
The ACP plans to work with PharosGraph in the coming months to see how attitudes and blame assignment shift in the ACP 15 community types as time goes by.
Read the original post and learn more about PharosGraph here: https://www.pharosgraph.com/post/mapping-inflation-and-the-factors-that-drive-it
Blaming immigration for inflation is such a weird direction to point the finger…wait until deportation really starts to bite into an already under supply labor force.